top of page
Foto: leitart

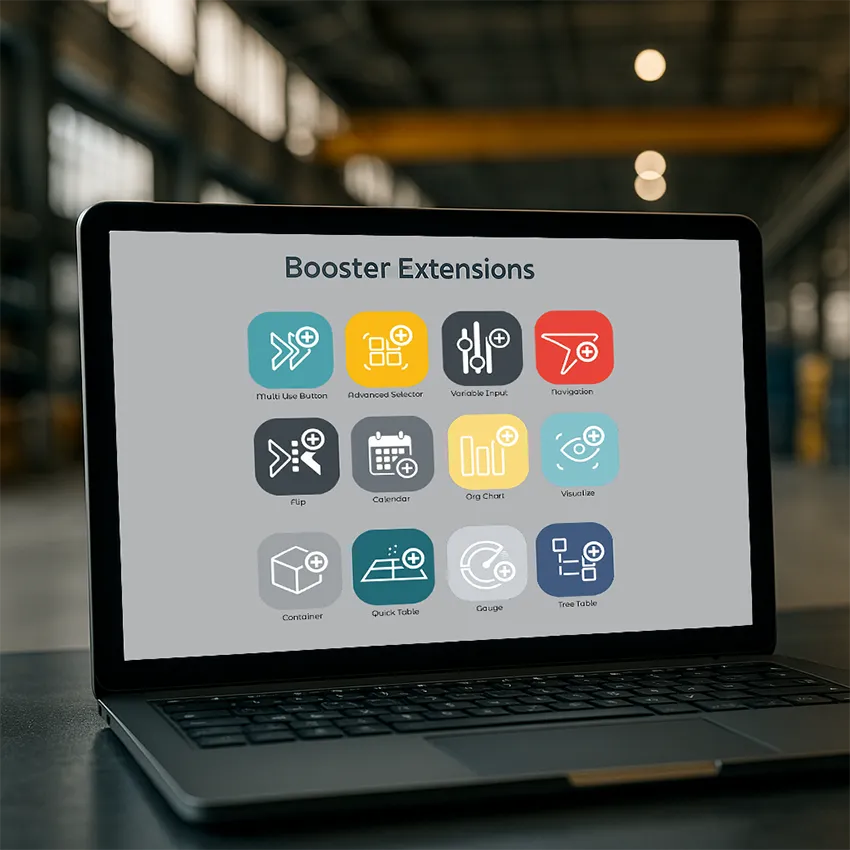
Leitart offers a variety of free extensions that simplify and enhance daily work with Qlik.

Try it! Its free!

Booster
Extensions

BOOSTER EXTENSIONS

All Features
at a Glance

MultiUseButton.png

With the MultiUse Button, you can control complex processes in Qlik with just one click. Whether setting filters, changing variables or starting entire workflows - flexible, individual and easy to configure. 

Multi Use
Button

Firefly 20250318143536.png
VariableInput.png

Variable Input

With Variable Input, you can enter values directly in Qlik and control them dynamically - for interactive analyses and flexible scenarios in your dashboards.

Container.png

Use the container to organize content clearly and interactively. Switch between charts, tables or filters - all in one place.

Container

AdvancedSelector.png

With the Advanced Selector, you can select specific values, combine filters flexibly and navigate effortlessly through your data - for maximum control and better analyses.

Advanced Selector

leitart_Extensions_AdvancedSelector.jpg
Navigation.png

With the navigation extension, you can create a user-friendly and structured navigation in your Qlik apps. Switch quickly between sheets, set targeted actions and improve user guidance

Navigation

Extension_Navigation.jpg
Calender.png

Calendar

With the Calendar extension, you can visualize time-based data in Qlik clearly and interactively. Click on dates to display details and keep an eye on important events.

Visualize_2.png

Visualize

With the Visualize extension, you can create individual, interactive visualizations that go beyond the standard Qlik charts.
Make complex data understandable and take your dashboards to the next level!

Flip_1.png

Flip

Flip makes your InfoBoard interactive: tiles rotate with a click and show additional information, KPIs or notes - compact and smart.

QuickTable_2.png

QuickTable

With the Visualize extension, you can create individual, interactive visualizations that go beyond the standard Qlik charts. Make complex data understandable and take your dashboards to the next level!

Org Chart__2.png

With the OrgChart extension, you can visualize hierarchies and structures directly in Qlik - ideal for teams, departments or projects. Clear, interactive and always up-to-date.

Org Chart

LeitartExtensions_OrgaChart-Office.jpg
Gauge_2.png

Gauge

With the Gauge extension, you can visualize target values, progress and performance clearly in Qlik - perfect for dashboards with a clear message

Icon_TreeTable.png

Display hierachical data without null rows. Aggregate the data to these collapsable rows.

Tree Table

Data+TreeTbale_edited.jpg
bottom of page